


The cheapest moment to change a system is before it exists. A clickable prototype puts real screens in front of the people who will use them, while a change still costs hours. The same change after launch costs weeks of rework and some of the team’s trust. That is why our diagnostics end with screens your team can click, not a document describing them.
People judge a screen far better than a description of one
People are poor at judging a system from a description and good at judging it from a screen. Show a dispatcher a job board and she will tell you in a minute that it hides the one field she checks first. Describe the same board in a requirements document and nobody will notice until launch.
A prototype also changes who owns the result. When the people who use a system have shaped its screens, adoption has already started. The principles behind this approach are set out in our manifesto.
Avoidable rework takes 40 to 50% of software effort
In 2001, Barry Boehm and Victor Basili reviewed the evidence on software defects and found that projects spent about 40 to 50% of their effort on avoidable rework.1 Every requirement that is wrong when building starts is paid for twice: once to build it, and once to undo it.
The same review found that a problem fixed after delivery often costs 100 times as much as one fixed during requirements and design. For small, noncritical systems, closer to most operations systems, the authors put the ratio at about 5 to 1.1 A prototype moves most of those discoveries to the low-cost end of that ratio.
Scalerrs had every service mapped before anything was built
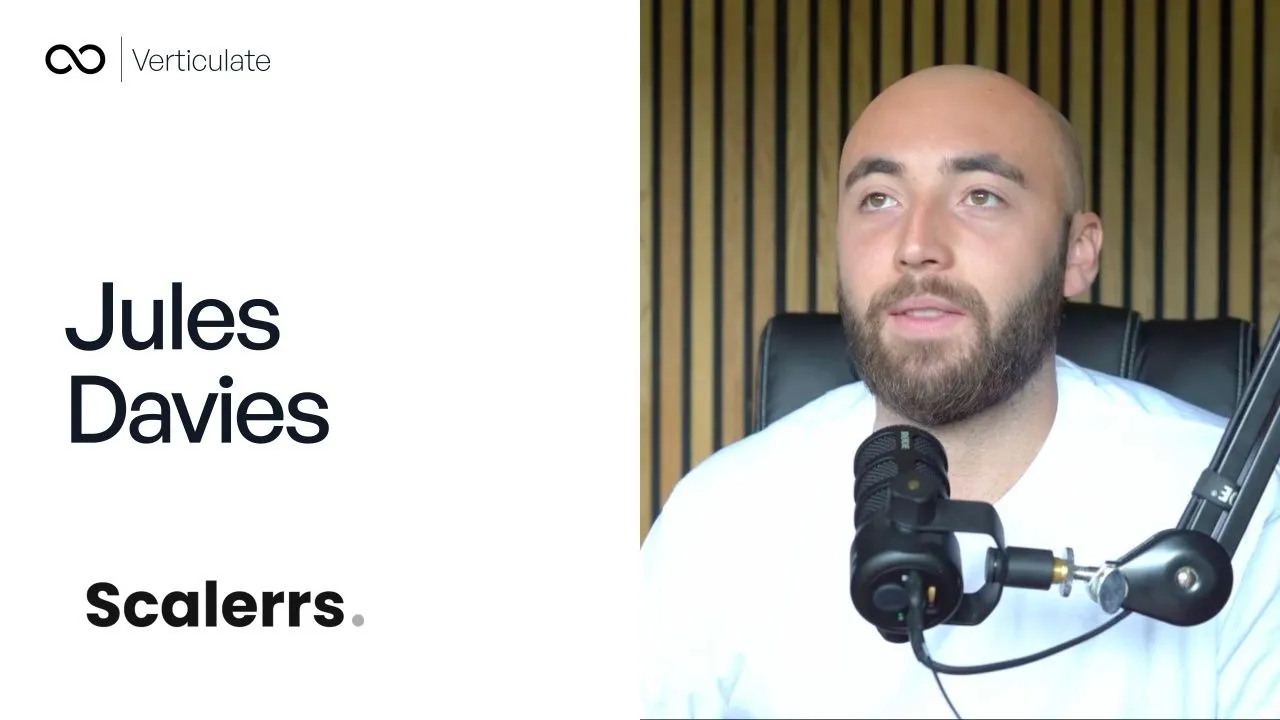
Scalerrs is an SEO agency. Before we built its custom operating system and its client portal, we mapped every service it sells. The founder, Jules Davies, singled out the pace of that first step: “how quickly you guys mapped out actually all of our services”. The build then followed the map. You can read the full case study.
Sources
- 1
Software Defect Reduction Top 10 List. Barry Boehm and Victor R. Basili, IEEE Computer, 2001.
Sample: Expert review of empirical software-engineering data, from the NSF-funded Center for Empirically Based Software Engineering
ModerateSound sources, but an older study of software projects in general, not operations systems for companies. Good for direction and rough size; the authors say the ratios vary with the size of the system.
- Moderate
- Sound method, but a different population, a smaller sample or an older study. Good for direction and rough size.